Prevent project delays months before they happen.
nPlan's AI has seen more than 780,000 real projects play out. It shows you where yours will lose time, why, and which interventions buy the most time back, months ahead.
Planners and risk teams: generate schedules from scope documents with Schedule Studio. Free to start.
Works with your preferred planning tools and AI assistant.







Independent forecasts of major live projects.
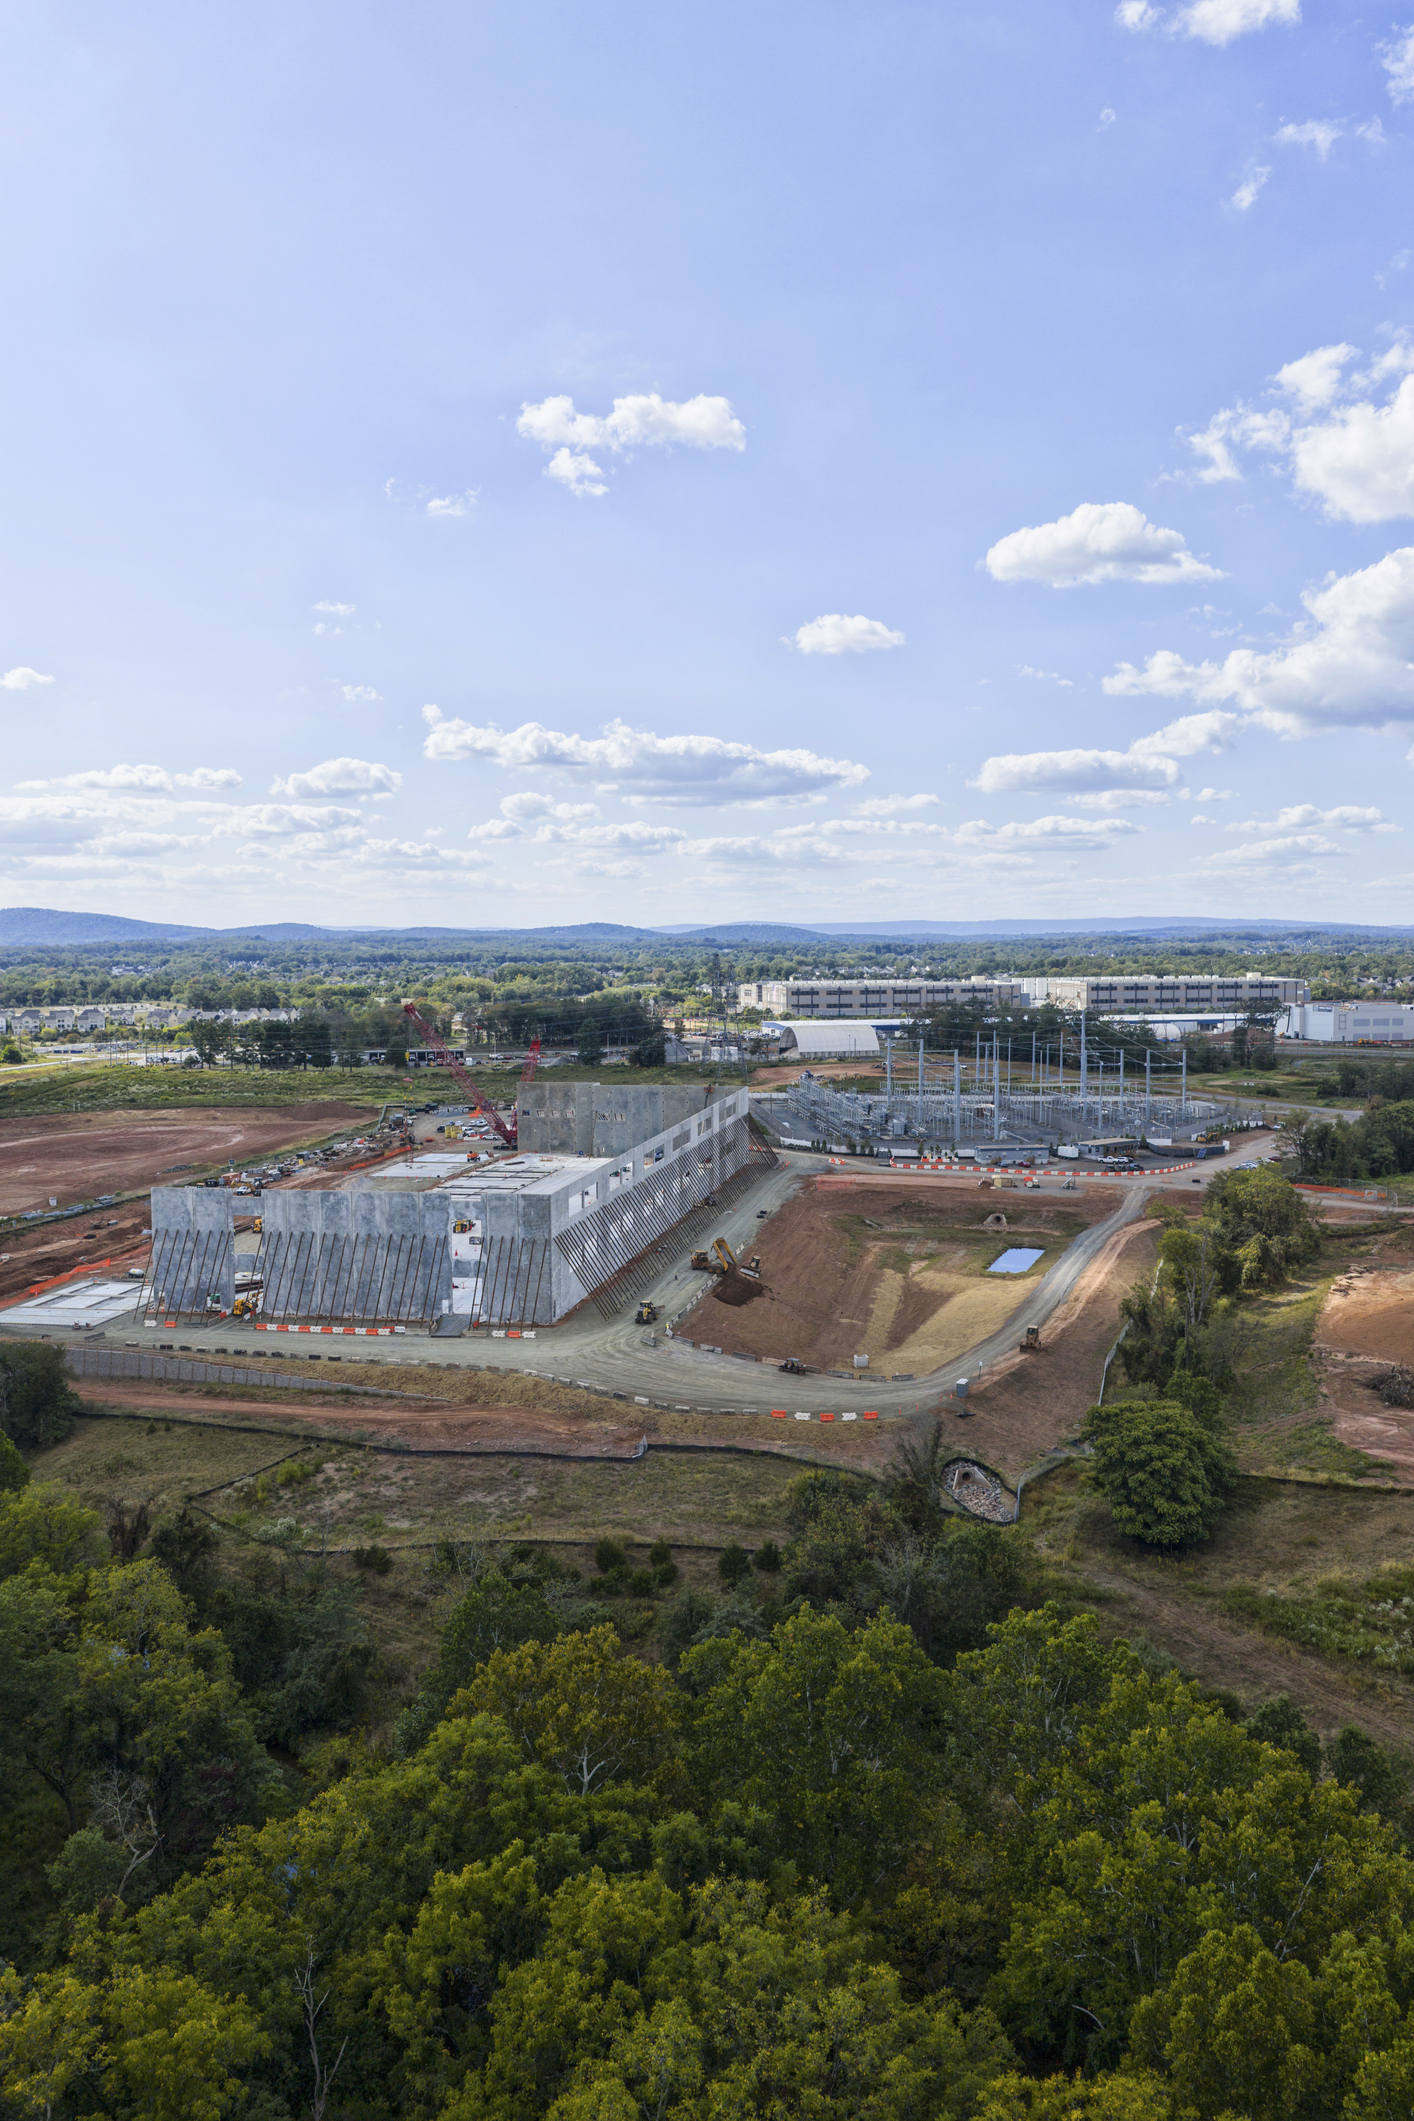
Will the Chapelcross data centre campus finish on time?
Eight 120MW buildings in Scotland.
32% chance of hitting the planned date
Mitigating every risk we found brings the campus back to within a day of its planned finish.
How we did it
Built the plan. From the planning application and public filings.
Forecast every key milestone. Using our dataset of more than 780,000 past projects.
Identified the risks. Site set-up alone adds 86 days to the date.
Ran six scenarios. To find the most effective interventions.
Will Disney’s new Cars Land open in 2030?
Disney’s new Cars-themed land at Magic Kingdom, Florida.
1% chance of hitting the planned date
On the current plan the land opens in the first half of 2031, so a phased opening is the only way to open in 2030.
How we did it
Built the plan. Eight phases from permits, filings and site reports.
Checked it against progress. Two dates reached, both as we projected.
Identified the risks. Ride testing and certification add 224 days.
Built a recovery plan. Eight interventions, each with its effect.
Will Darlington’s first small modular reactor be running by the end of 2030?
The first small modular reactor in the G7, in Ontario.
1% chance of hitting the working plan date
OPG’s end-2030 target leaves too little buffer. Six decisions win back 283 days, and four of them are due before 1 December 2026.
How we did it
Built the plan. From OPG’s filings with the energy regulator.
Forecast every key milestone. Using our dataset of more than 780,000 past projects.
Checked it against progress. Nine dates reached. Ours was nearer on six.
Tested six decisions. Each with what it buys back and when to decide.
Will your project finish on time?
Send us your plan and the date that matters most, and we’ll run the same forecast on your project.
Share your plan in whatever format your planners already use, along with the date you care about.
We project every key date, with a first look ready in about 30 minutes.
We show what’s driving any delay, ranked by how much each reason moves your date.
We run the scenarios with your team, so you can see how much time each option buys back.
Your plan remains private to you, and nothing you upload is used to train the model unless you opt in.


The nPlan difference - a vast archive of past project data
The foundation of everything we’ve built is our dataset of more than 750,000 past project schedules - the largest collection of past programmes in the world, representing every capital project sector.
Why does it matter?
Past project schedules for retrospective analysis

With experience building projects for:

Highways

Rail

Public buildings

Commercial Buildings

Heavy infrastructure

Oil & Gas

Utilities

Data Centers
Plan, forecast, accelerate.
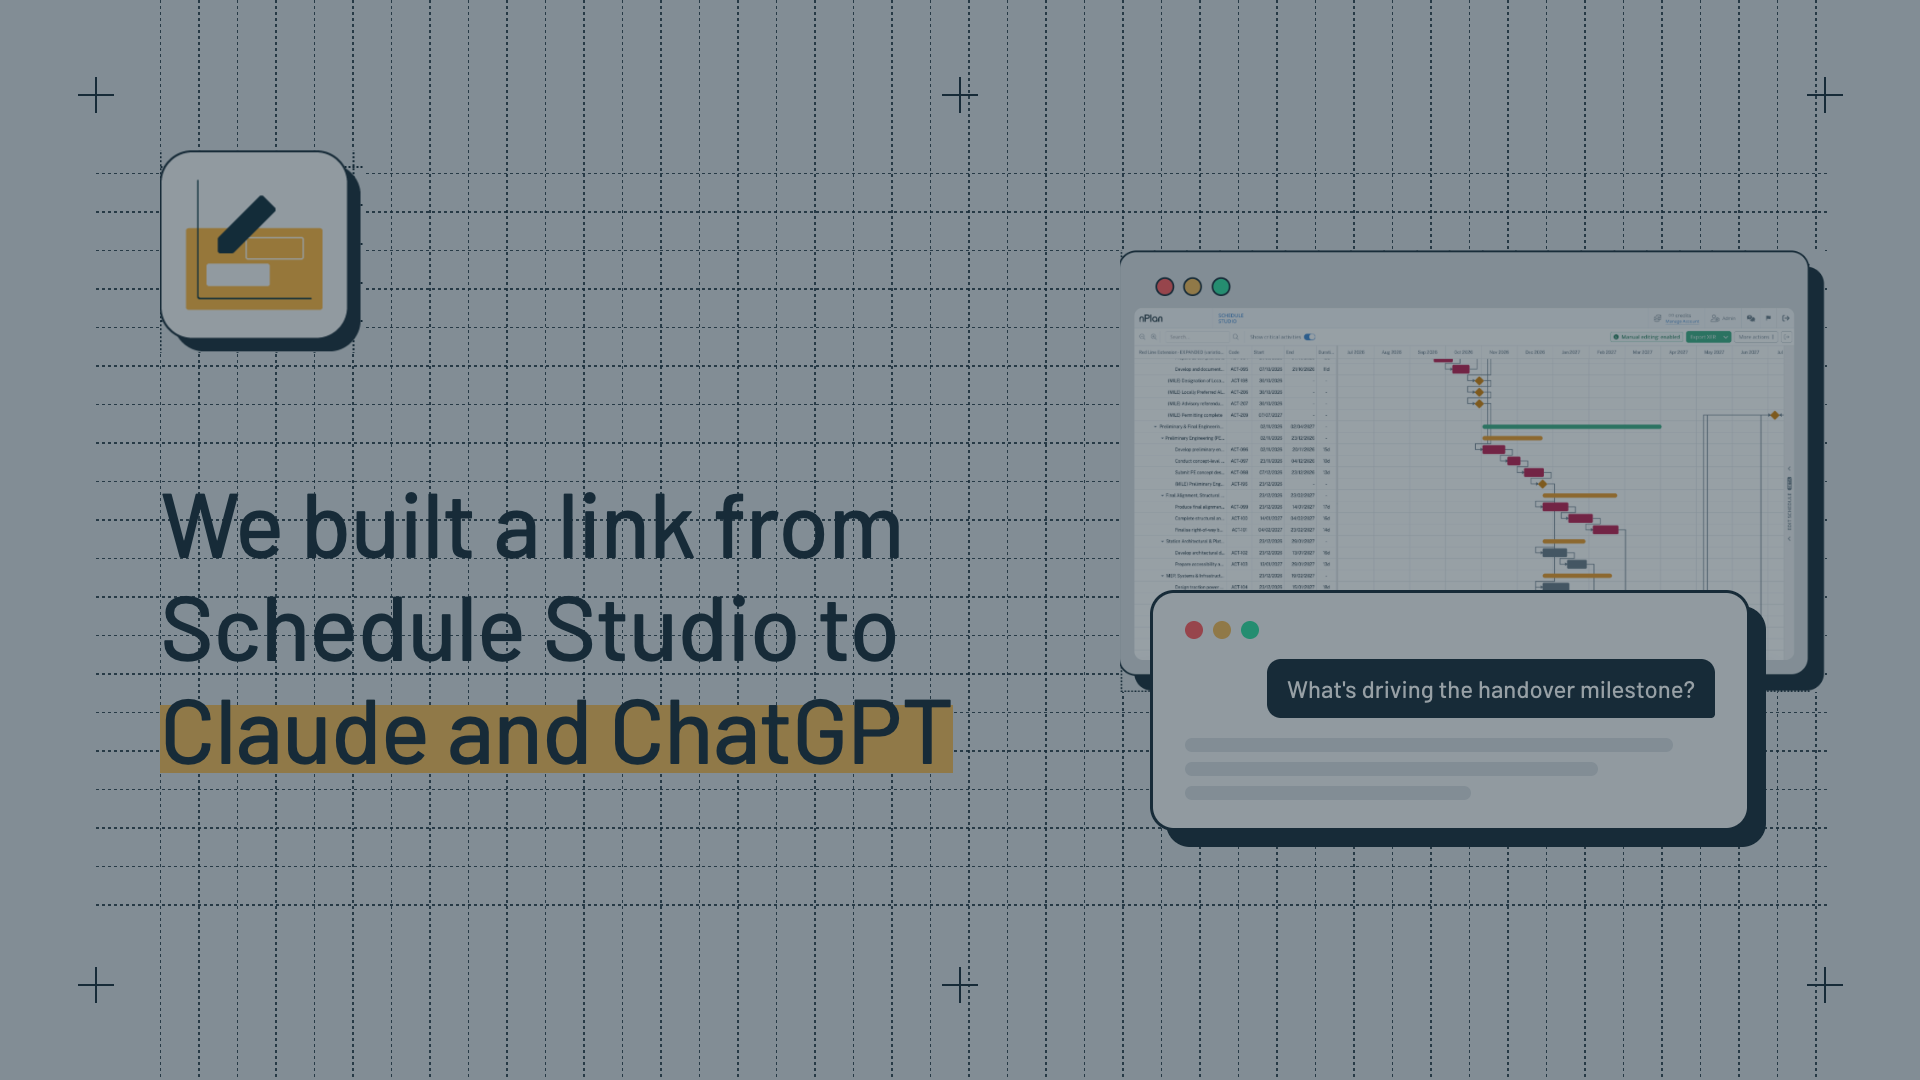
Run tight decision loops at the speed of AI. Schedule Studio builds and edits your plan from your project documents. Insights forecasts every activity and key milestone, shows you where risk is building on the critical path, and ranks the activities that most threaten your dates. Compare mitigations side by side and act on the one with the most impact, while there's still time. Barry, nPlan's AI agent, can run the whole loop for you. Your team makes the critical decisions.
Run the loop yourself, or let Barry, nPlan's AI agent, run it for you.
Build and edit the plan
Draft the plan in minutes from your scope, designs, 2D and 3D drawings, contracts and tender. Then edit it, check it for gaps and errors, compare versions and add progress, all in one place.
Check progress
Insights checks every update and flags work that was due but not done, so the forecast uses what actually happened.
Forecast every activity
A data-driven forecast for every activity and key milestone, the chance of hitting each date, and a ranked list of the activities that pose the most risk to your milestones.
Test before you commit
Compare mitigation scenarios and see which has the most impact on your key milestones.
Track and report
Track every action your team takes and the risk themes across the project. Barry builds your assurance report and board pack from your forecasts, risks, scenarios and mitigations, all in one place.
Scale this process across multiple projects with nPlan Portfolio, and recover more time by addressing portfolio-wide risks.
Data-driven forecasts, validated against real outcomes.
Insights forecasts with a model trained on more than 780,000 past project schedules. Each forecast shows the full range of outcomes, not one date.
Finish ahead of schedule.
nPlan Insights ranks the mitigations in your plan by how much time each one recovers on your key milestones. As your team acts, every schedule update shows how much time you've recovered so far.
Join the nPlan Academy
We’ve created a series of courses to enable current and future nPlan users to familiarise themselves with our software and the fundamentals of our unique technology. Master the new world of AI project controls and delivery in a few short hours, and gain new career-enhancing certifications in the process!

Gain recognised certifications to boost your career.

Go ‘from zero to hero’ in approximately 2 hours

Enjoy full access for the duration of your employer’s engagement with nPlan.
Applying nPlan’s AI capability at a portfolio oversight level allows us to quickly target our leadership interventions to the right areas across a large portfolio of projects, to mitigate risks to outcomes being delivered when they are needed.

Construction as an industry hasn’t had a comprehensive, systematic knowledge transfer mechanism. We look at nPlan as a productivity enabler to extract the knowledge and expertise embedded in the data that we’ve already captured across historical project schedules and activities. nPlan then contextually delivers that intelligence and insight in a way that improves the outcomes of new projects during their execution phase.

We brought nPlan into the fold, handed our schedule over to nPlan, at that point they’re able to really give us the step-change we were looking for, they gave us a lot of intelligence and insights around the schedule about its probability of success as you would expect out of any QSRA but they really helped us delve into the details of where the threats and opportunities were in the programme, the volatility, the spread of probability, so suddenly we found ourselves in a situation where we had a whole different mass of data we were going to use…

nPlan is a critical part of our strategy to ensure predictable delivery and provide effective oversight across our entire investment programme. By leveraging AI and historical data, we can make smarter, data-driven decisions.

The new and improved Driving Paths visualization in nPlan Schedule Studio is really outstanding. I use this feature to discover and explore multiple float paths for any target activity in our 17,000-activity schedule. It's a great visual aid for anyone who isn't satisfied with pages and pages of CPM printouts.
With nPlan as a delivery partner, we’re able to take a new approach to analysing our schedules - removing the human bias in favour of learning from actual data and historical performance - and driving efficiency into the process. Being able to get more frequent analysis done on a larger volume of schedules is a game-changer for us.

Challenging our team’s biases without emotion to identify potential project risk is the most insightful aspect of the nPlan results.

Deepen your forecasting and risk management expertise -and find out what makes us tick - on our blog👇